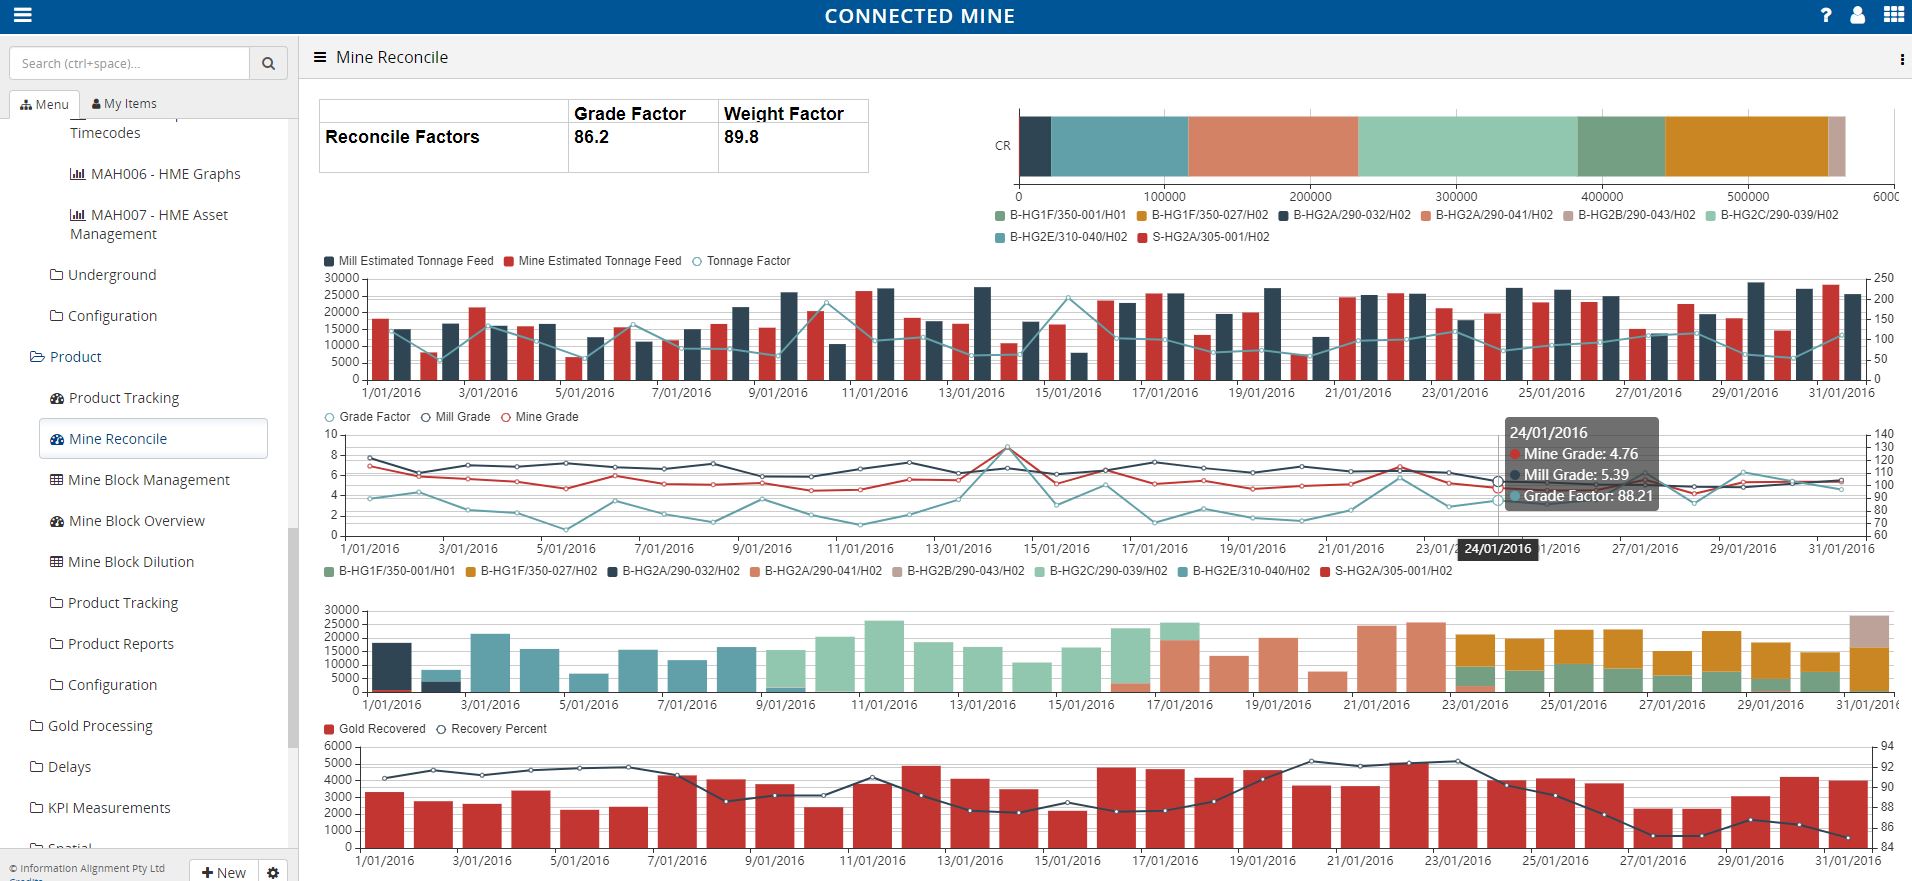
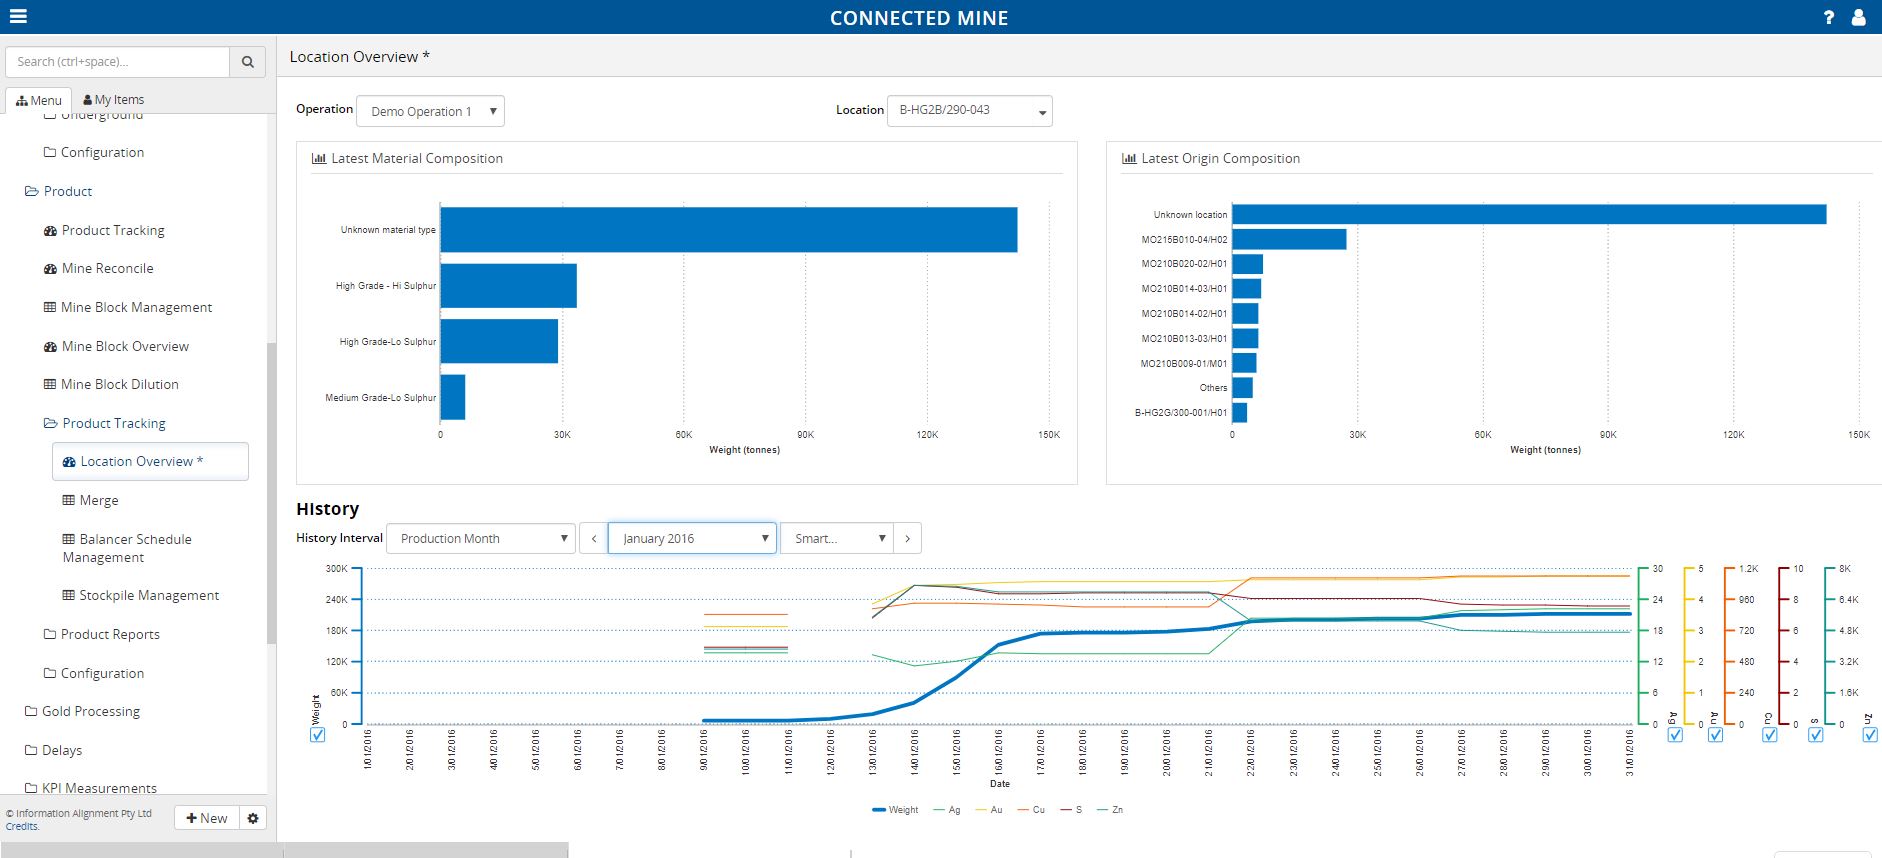
Operational Mining Dashboards for Modern Production Teams
Plan vs actual, time usage, payload, drill and blast and reconciliation, on mining dashboards built from one validated data model. Near real-time, from pit to port.
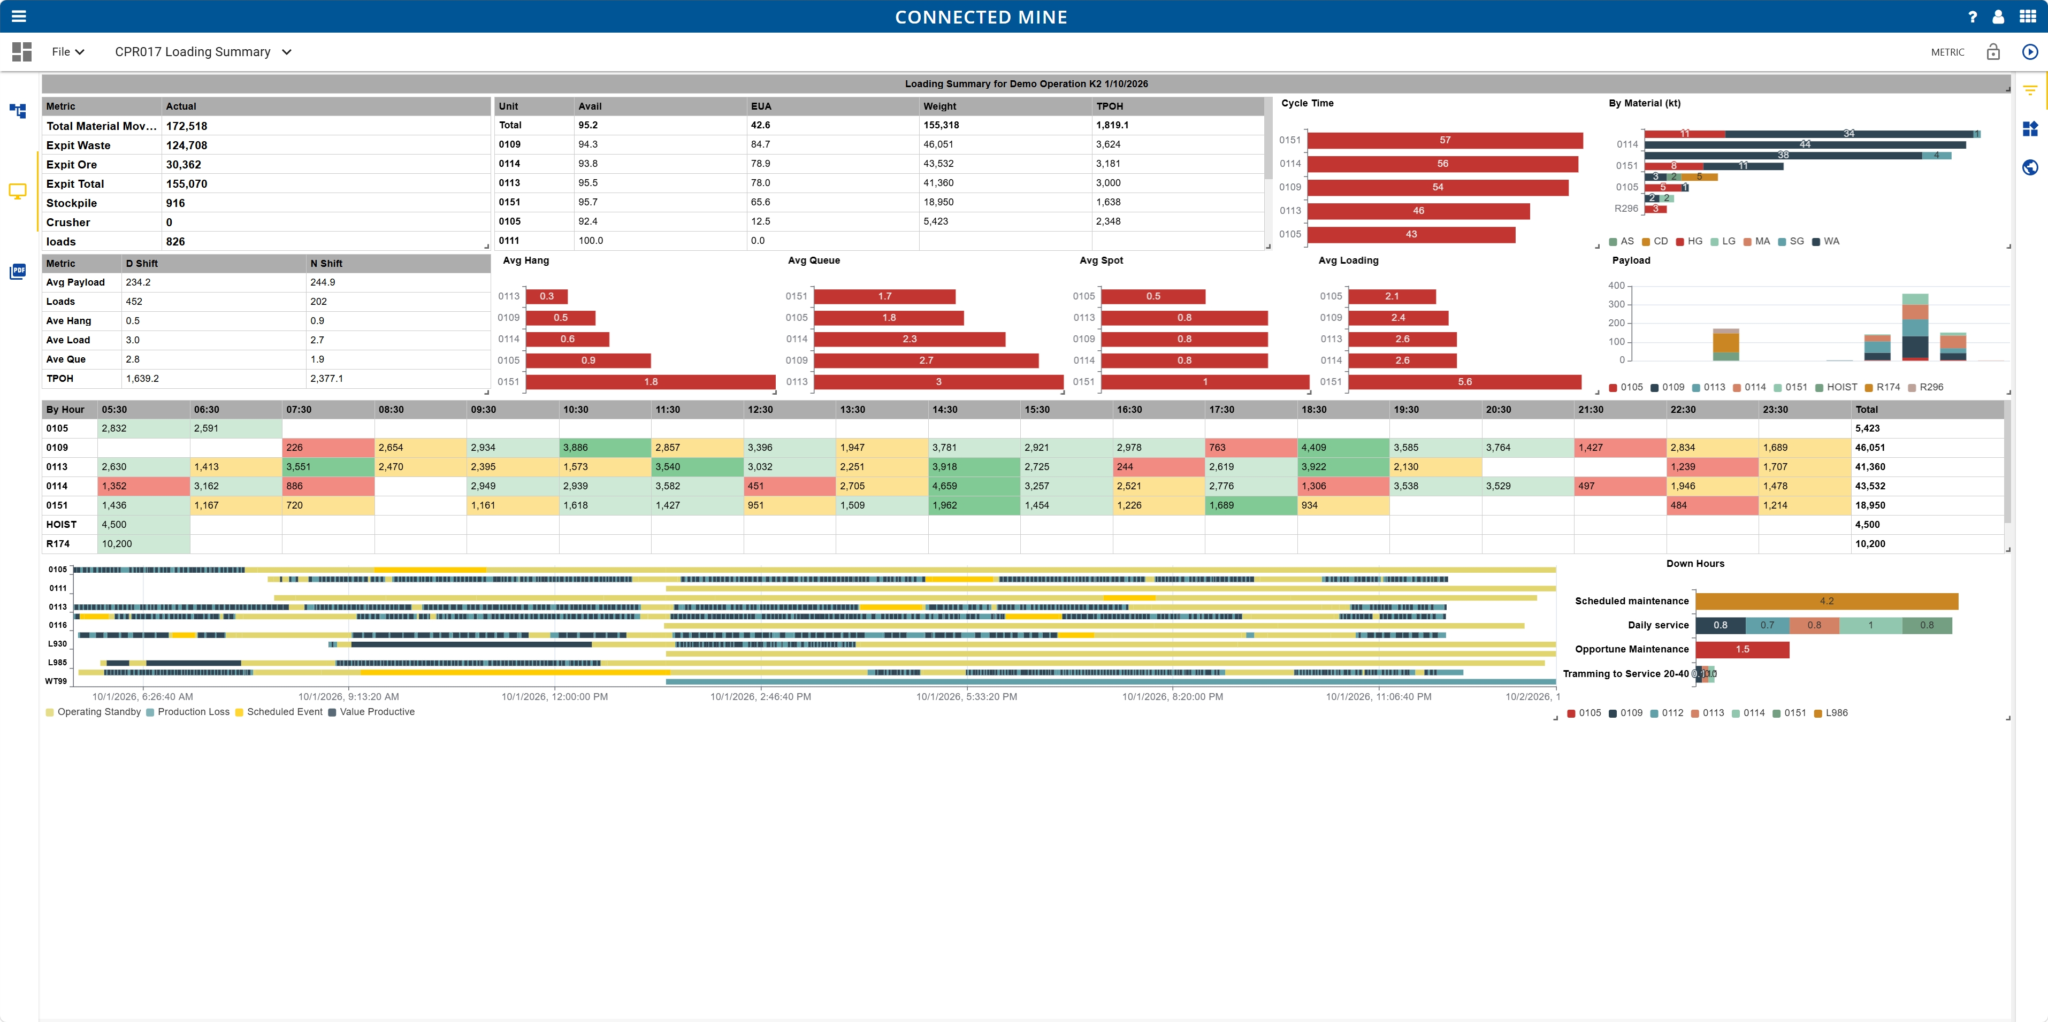

Plan vs actual, time usage, payload, drill and blast and reconciliation, on mining dashboards built from one validated data model. Near real-time, from pit to port.
Most operations try to build mining dashboards by plugging Power BI straight into raw fleet databases. Generic BI tools don’t understand delay classifications, haul cycles or shift handovers, so every dashboard starts with an argument about the numbers.
Every dashboard reads from the same validated data, so production, drill and blast and the mill all report the same numbers.
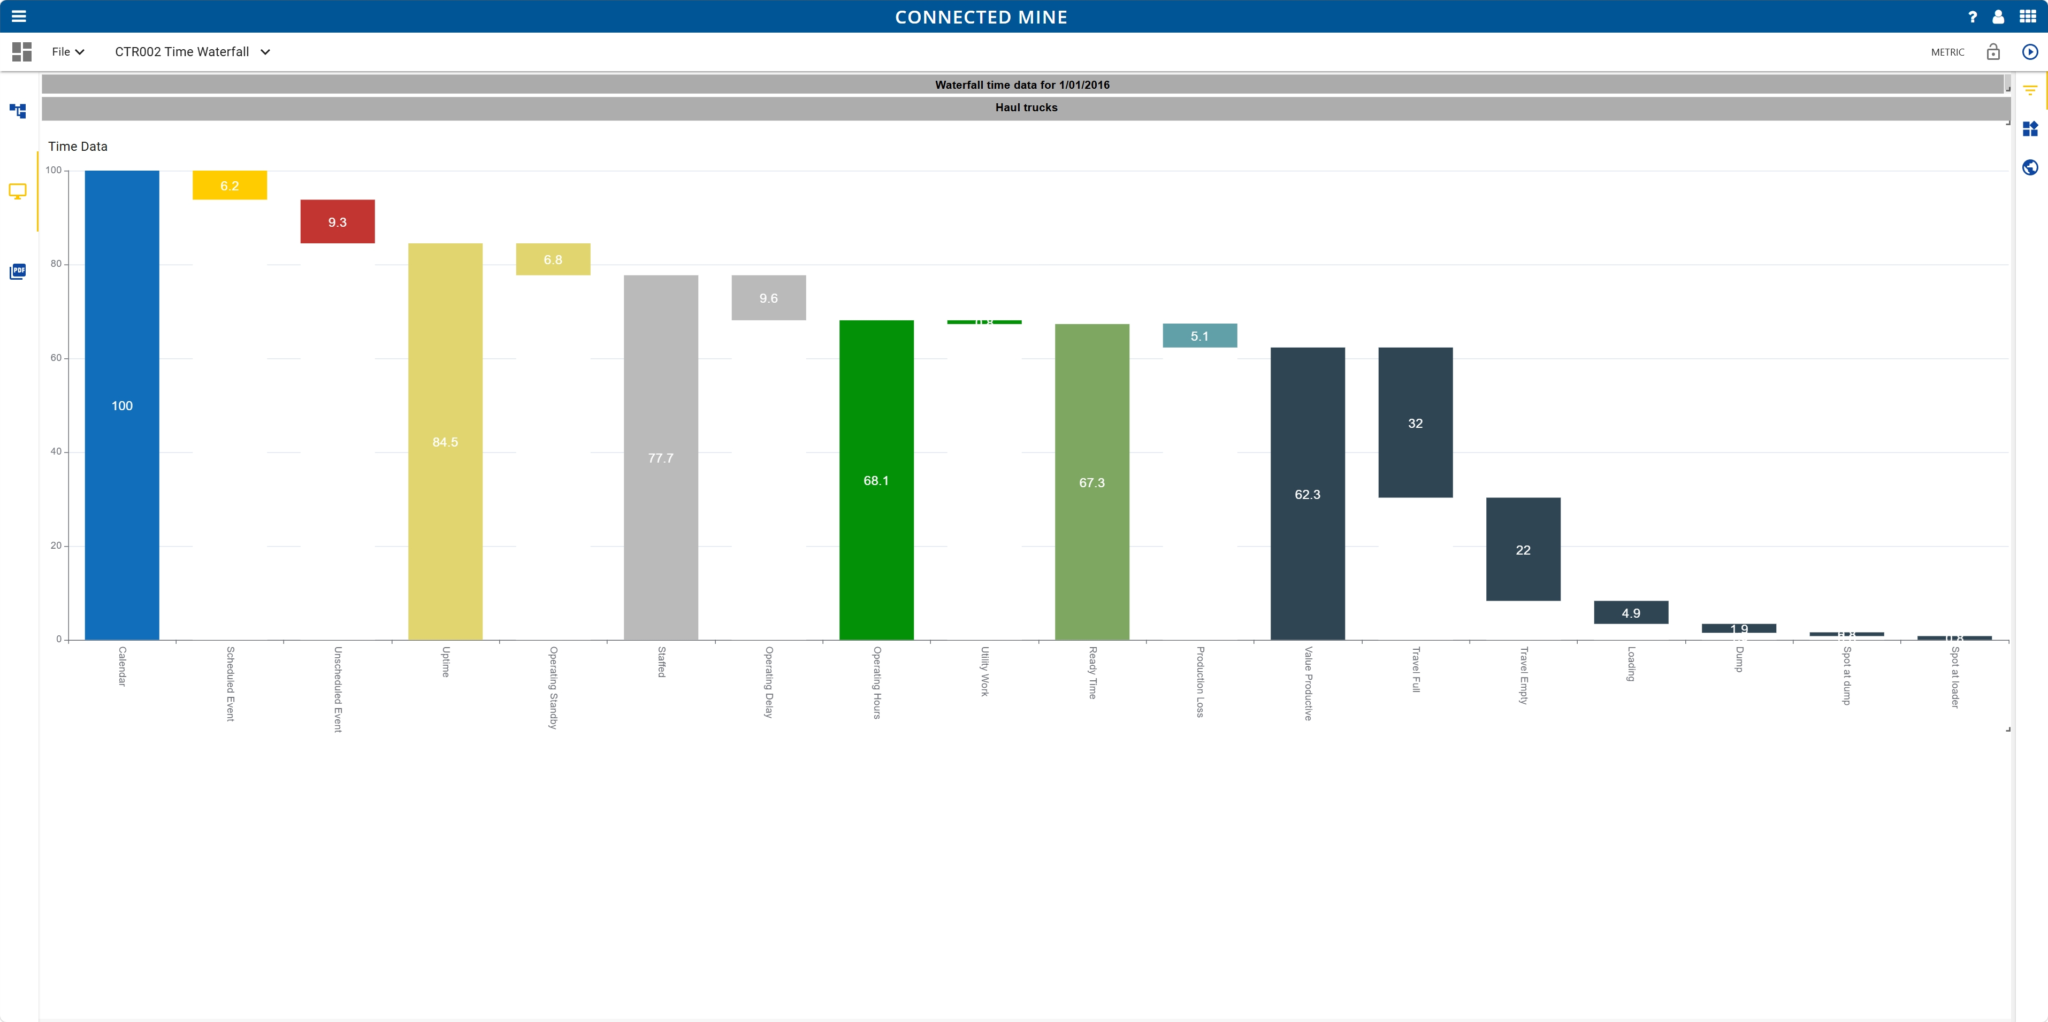
Calendar time to value productive hours, reported against your site’s own time usage model.
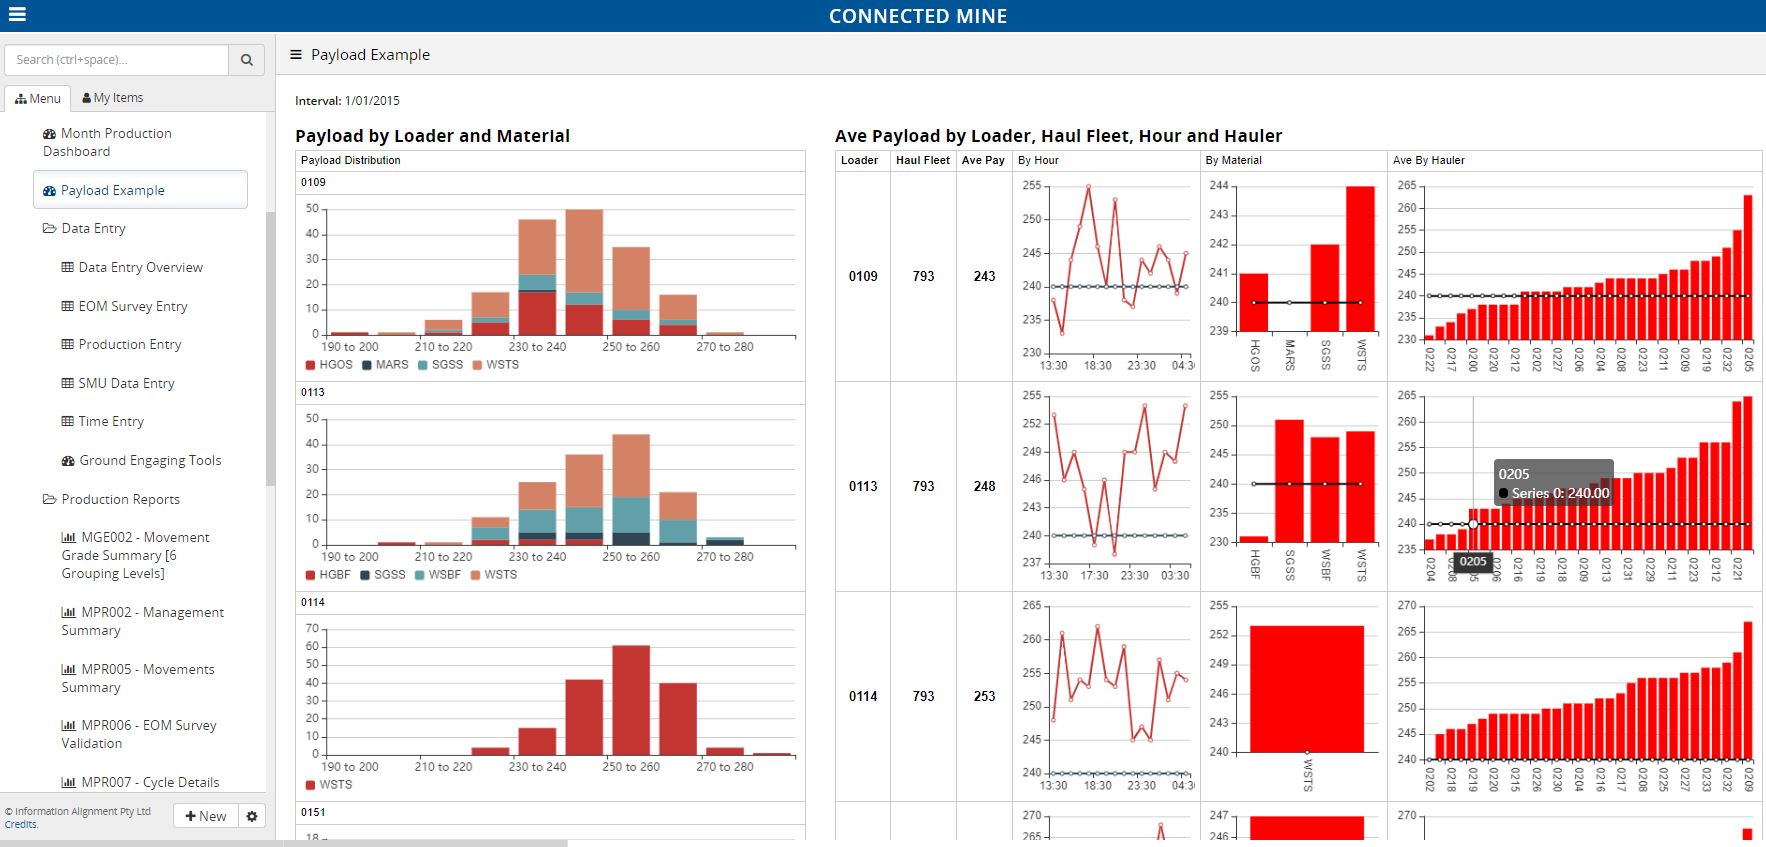
Payload distributions by loader, material and hauler, with averages by hour.
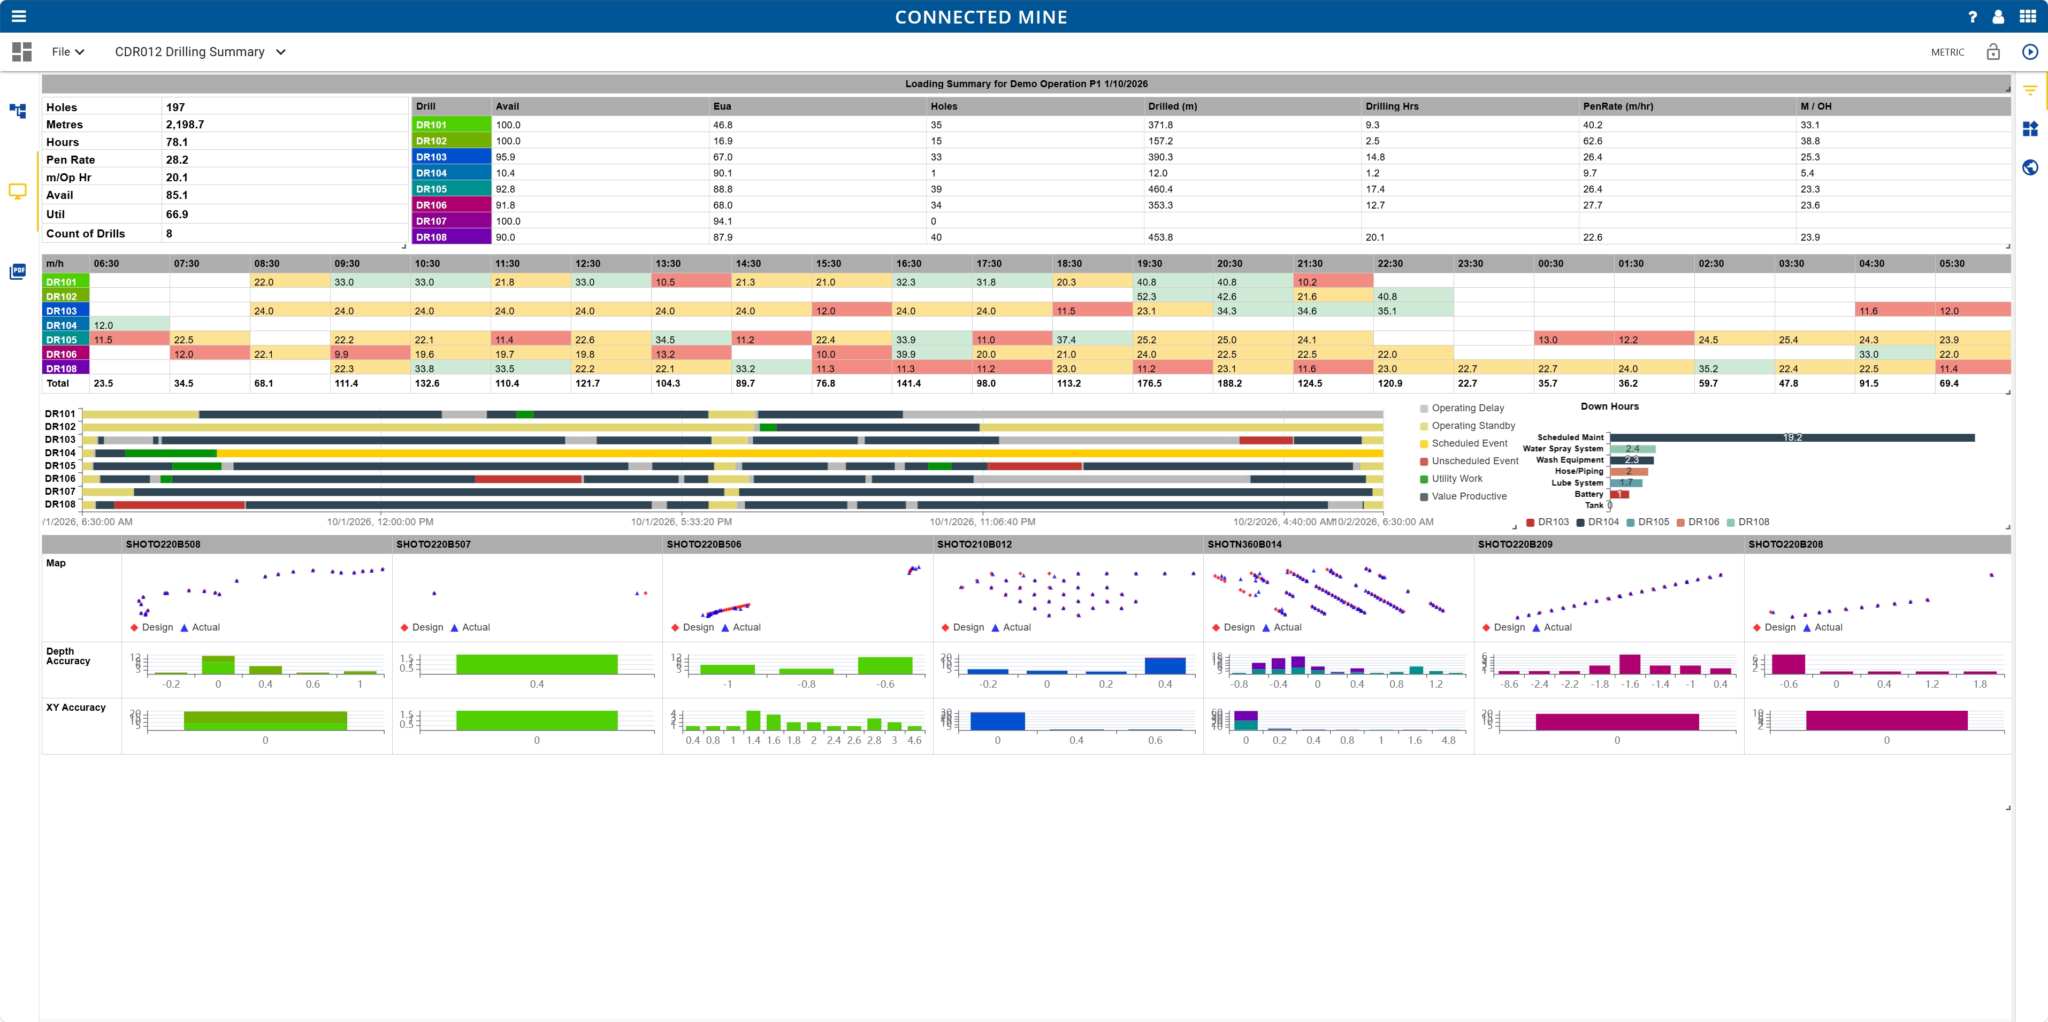
Metres, penetration rate and availability by drill, with hole accuracy for every shot.
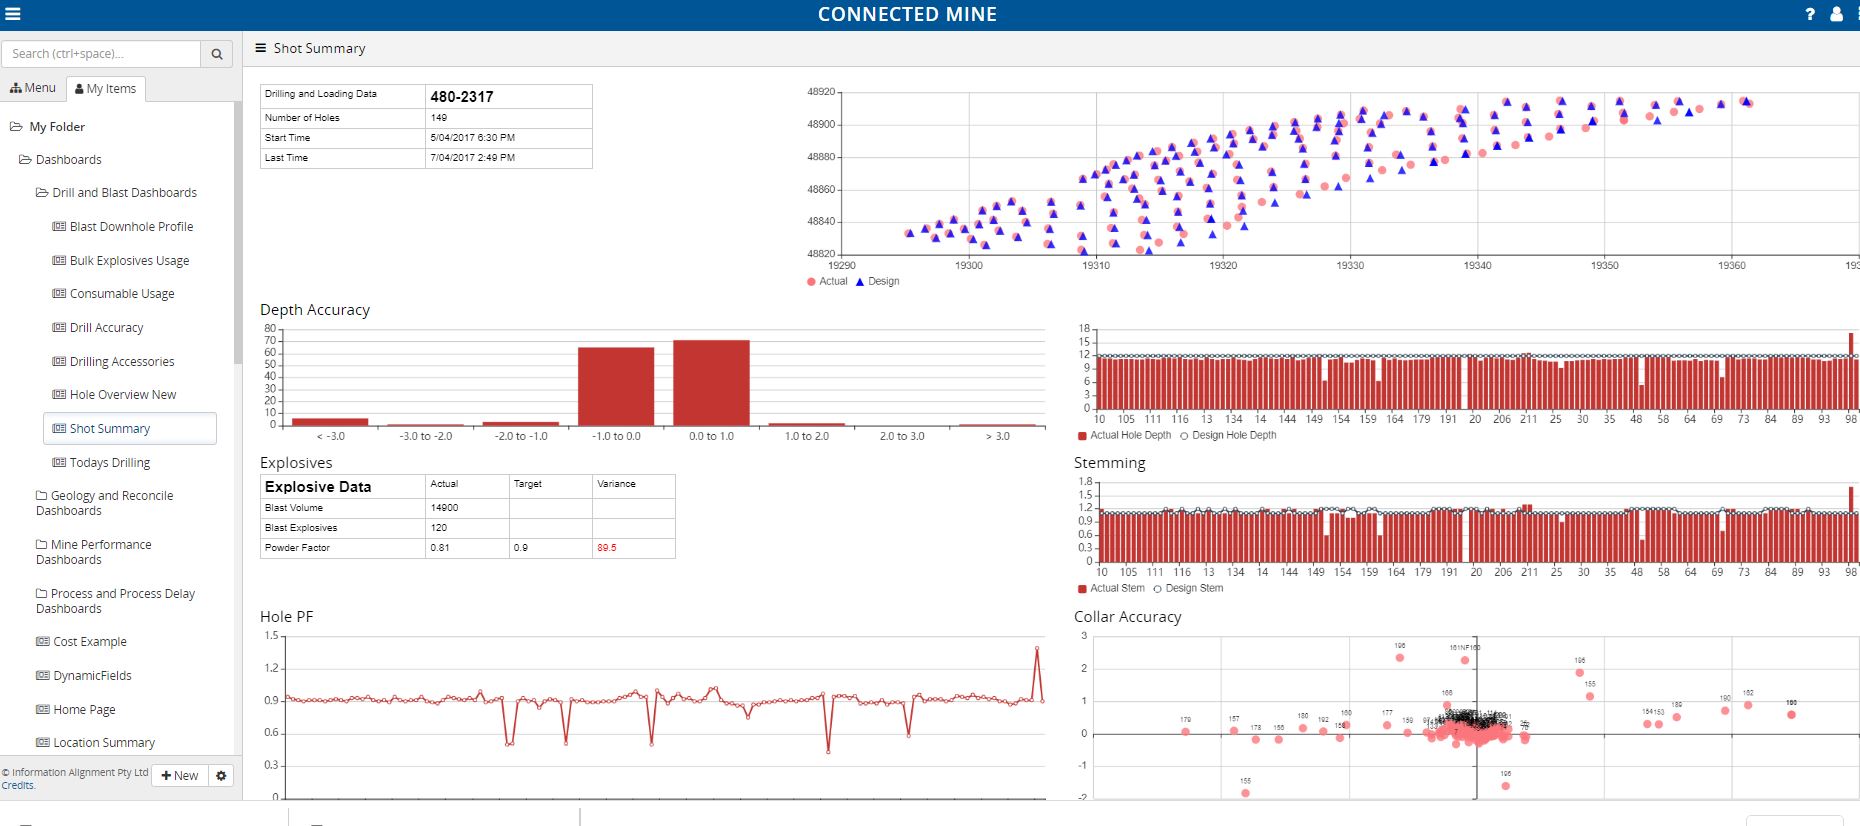
Design vs actual hole positions, depth accuracy, stemming and powder factor against target.
Connected Mine connects to your fleet management, SCADA, mine planning, historian and ERP systems first, then validates the data before any dashboard reads it.
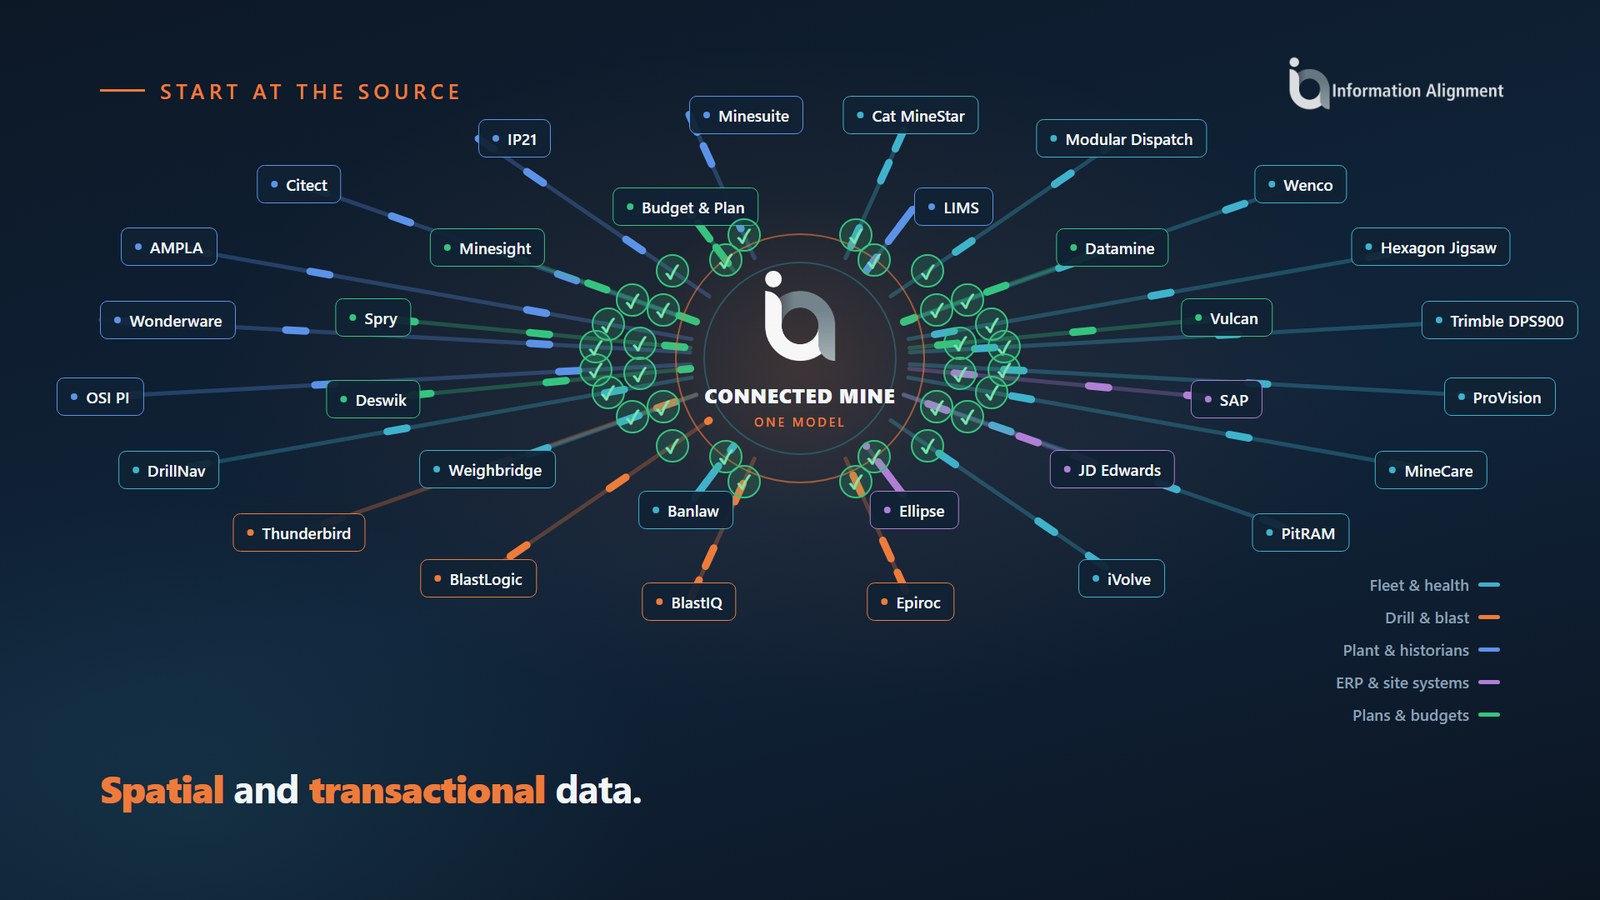
Delay codes, material classes and shift definitions agreed once and applied everywhere.
Dashboards report against your site’s own model, or several, not one imposed on you.
Every number can be traced back to its source, so site managers trust what they see.
Power BI mining dashboards
Connected Mine gives Power BI a mining data model that already understands delays, haul cycles and shifts. With StarStream, your team builds Power BI mining dashboards on a ready-made star schema instead of raw fleet tables.
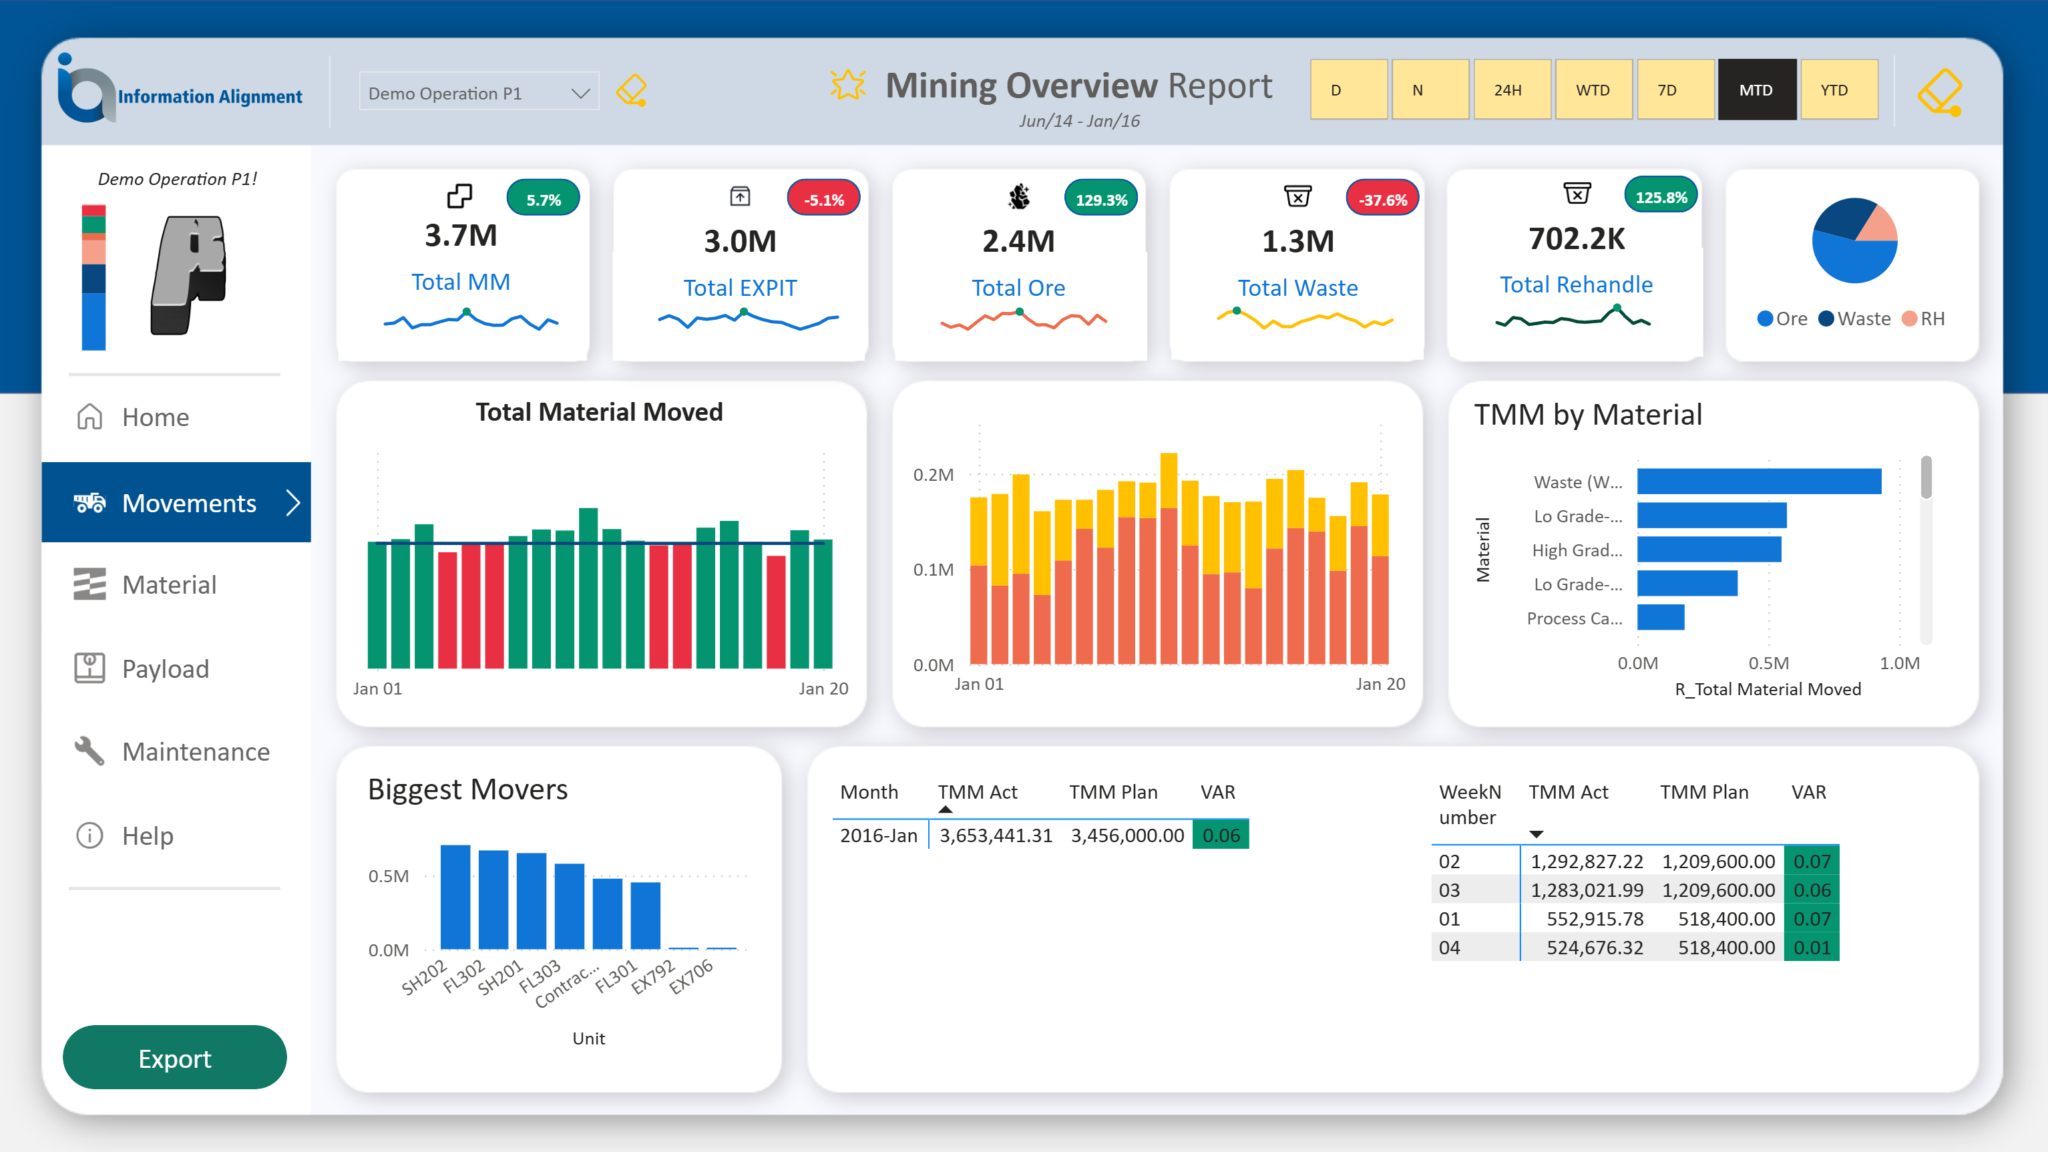
Power BI Mining Overview report built on Connected Mine data
Each module adds its own dashboards to the Connected Mine platform, all on the same data.
C-MP
Production, time usage, drill and blast, reconciliation and stockpile dashboards.
C-PP
Plant performance and metallurgical balance, correlated with what came out of the pit.
C-DAS
Dashboards, automated reports and analysis, with commentary built in.
C-SI
4D views that map spatial, fleet and operational data over the pit, including cycle trace.
Need to act while the shift is still running? See STIC short interval control.
What should be included in an operational mining dashboard?
An effective operational mining dashboard includes pit-to-port reconciliation, haul cycle and time usage analytics, drill and blast physicals and plant metallurgical balancing, all driven by a validated single source of truth.
How do Connected Mine dashboards integrate with site systems?
Connected Mine ingests data directly from fleet management systems, SCADA, plant historians, weighbridges and geological modelling tools, so dashboards replace spreadsheet and reporting silos.
Can I use Power BI for mining dashboards?
Yes. Connected Mine integrates with Microsoft Power BI, Fabric and Databricks. With StarStream, your team builds custom Power BI dashboards on a ready-made star schema of validated mining data.
What is the difference between a mining dashboard and short interval control?
Mining dashboards report validated production after the fact and through the shift. Short interval control software such as STIC alerts the control room to critical events so they can be fixed while the shift is still running.
Talk to us about the dashboards your production team needs.