Connected Data Analysis Services: Mining Analytics and Reporting Software
The reporting and analysis layer built into every Connected Mine module. Build dashboards and reports on validated mine data, add commentary, and publish to Power BI.


The reporting and analysis layer built into every Connected Mine module. Build dashboards and reports on validated mine data, add commentary, and publish to Power BI.
Data from different systems, calculations that live in someone’s spreadsheet, and comments lost in email. C-DAS puts the reporting on the same validated data and the same rules for everyone.
Start from the validated Connected Mine data store, filtered to the interval and tags you need.
Calculate, join, pivot, union and unpivot, with each step visible on the canvas.
Tables, matrices, multi-charts, waterfalls, Sankey, Gantt, heatmaps and spatial views.
Share dashboards and reports, export to PDF, or publish to Power BI.
Drag components onto a canvas and connect them. Casual users get there quickly, and experienced analysts get the depth they need.
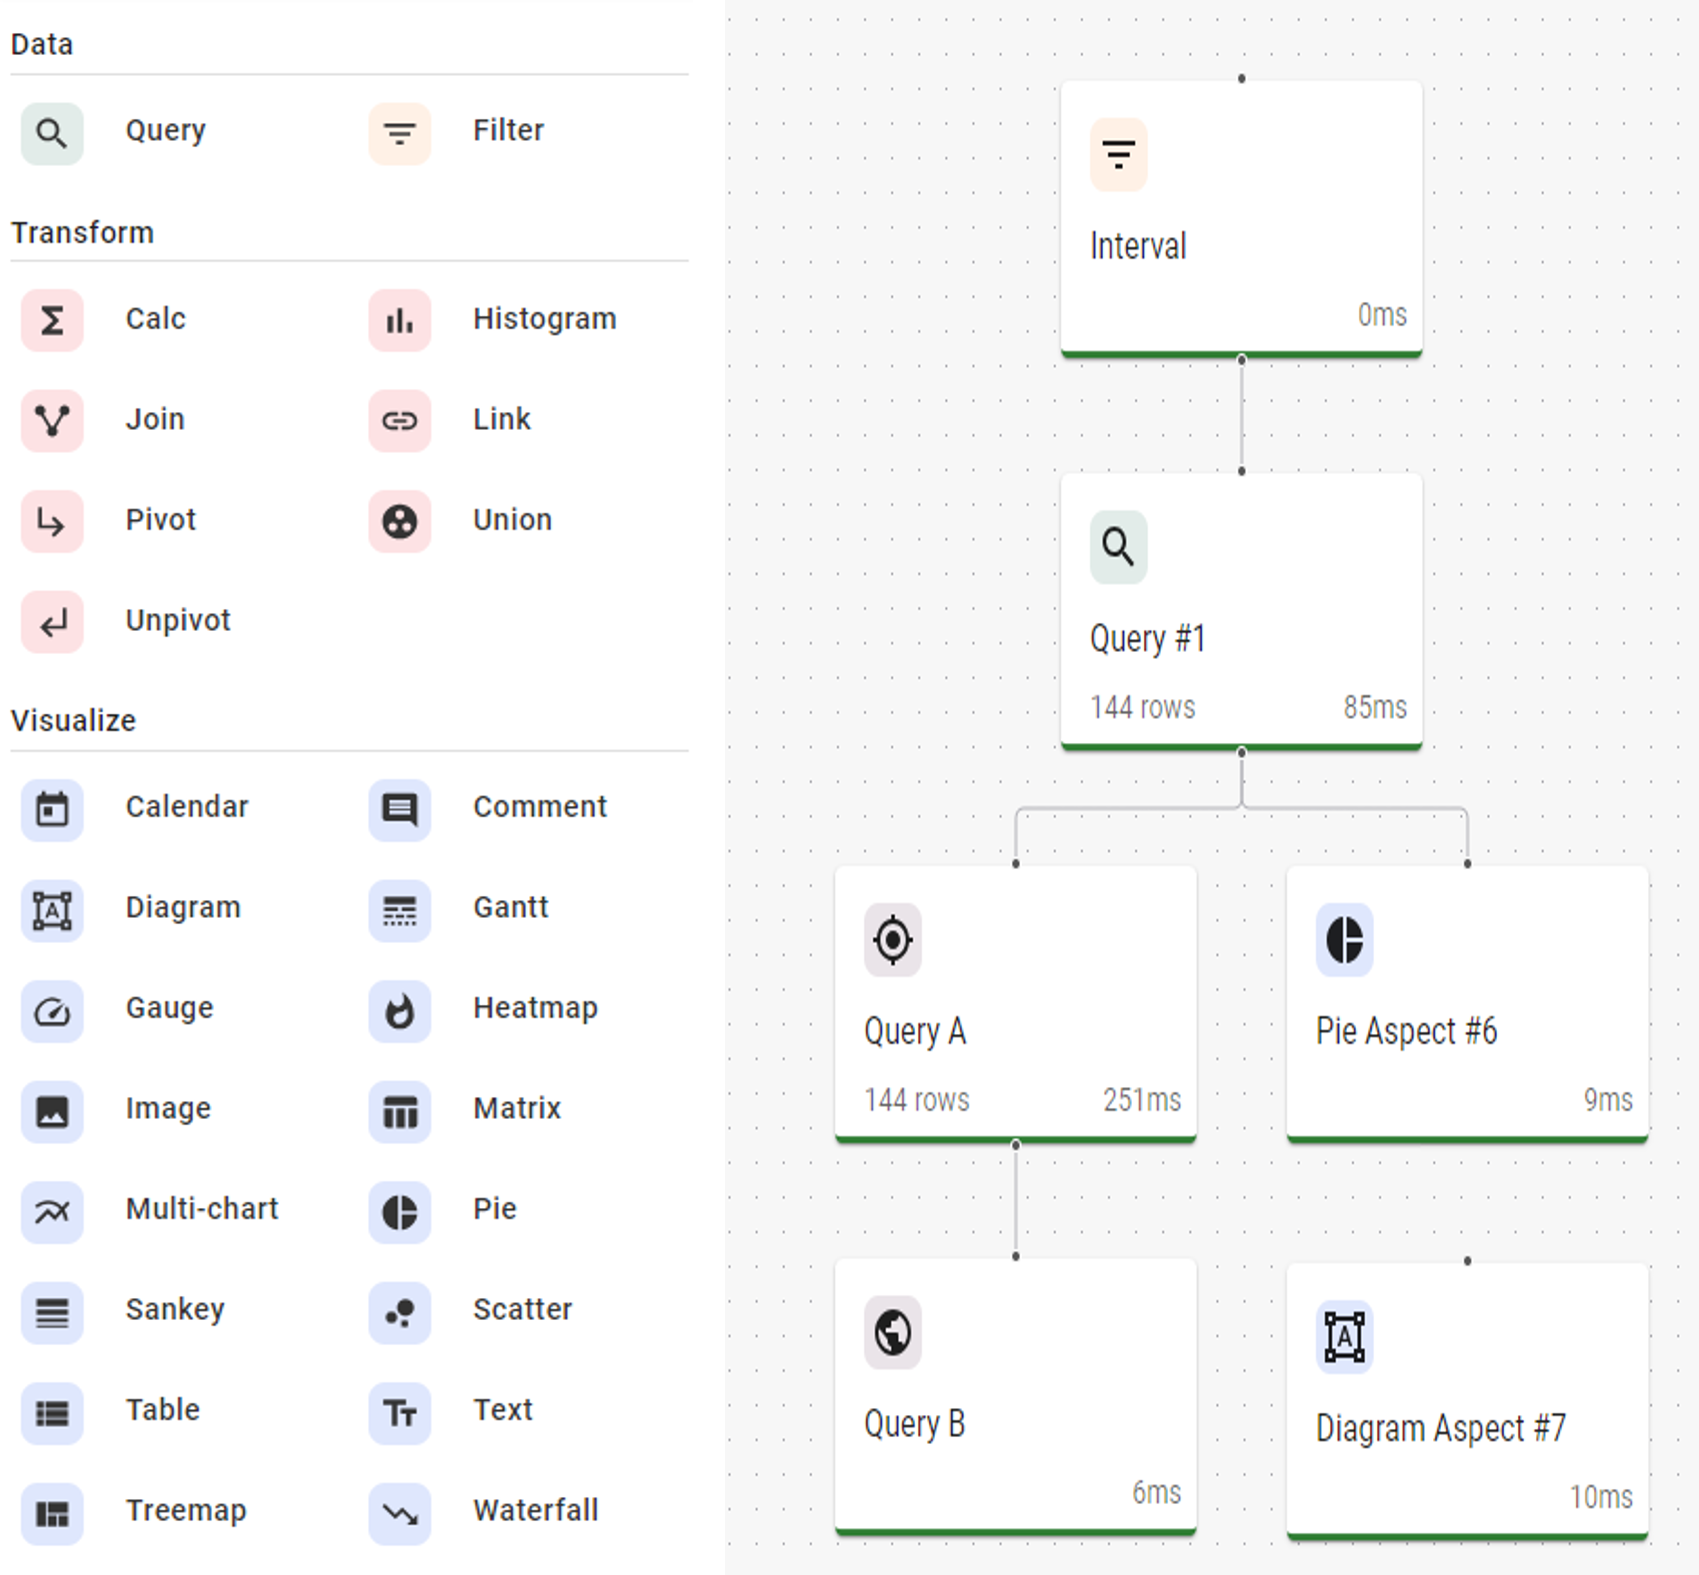
The component palette and a report flow from interval to query to charts
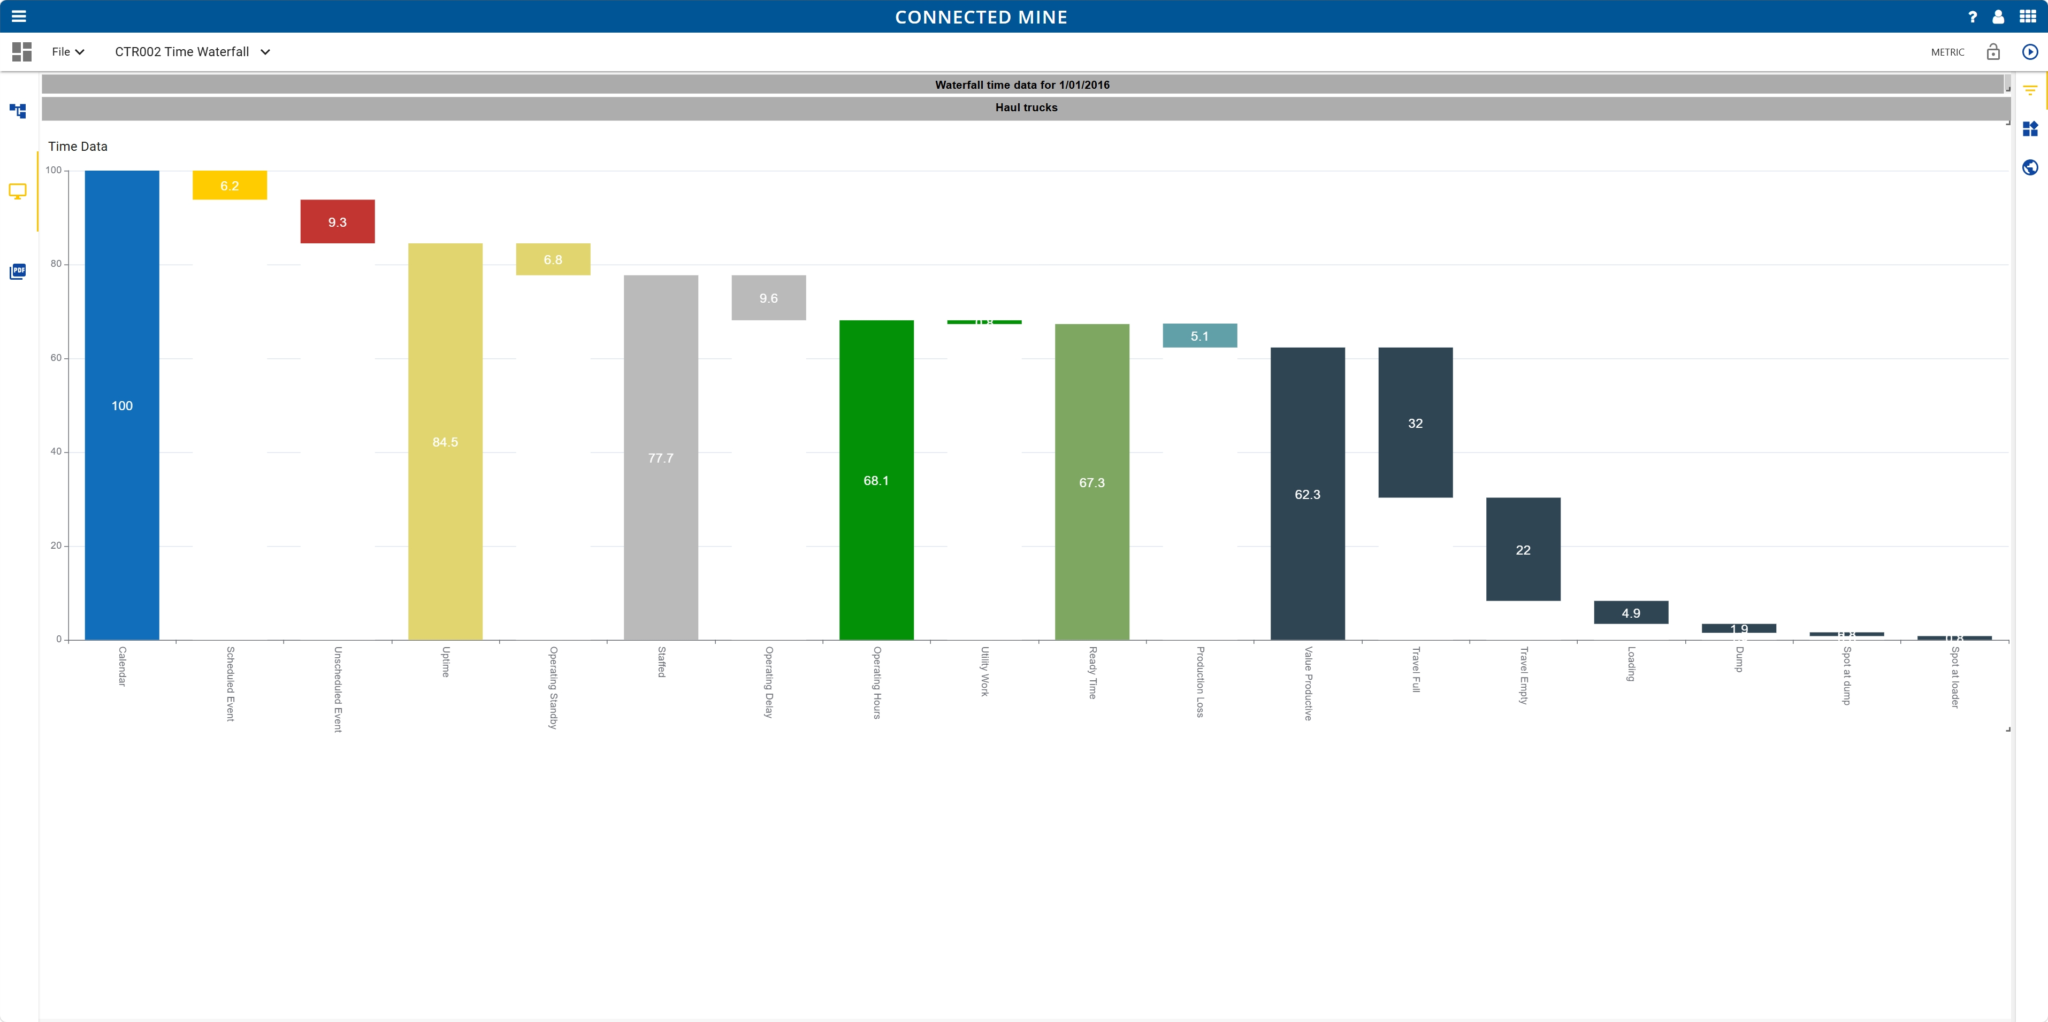
Time waterfall: calendar time to value productive hours
From the shift report to the month end pack, built on the same data. See examples on our mining dashboards page.
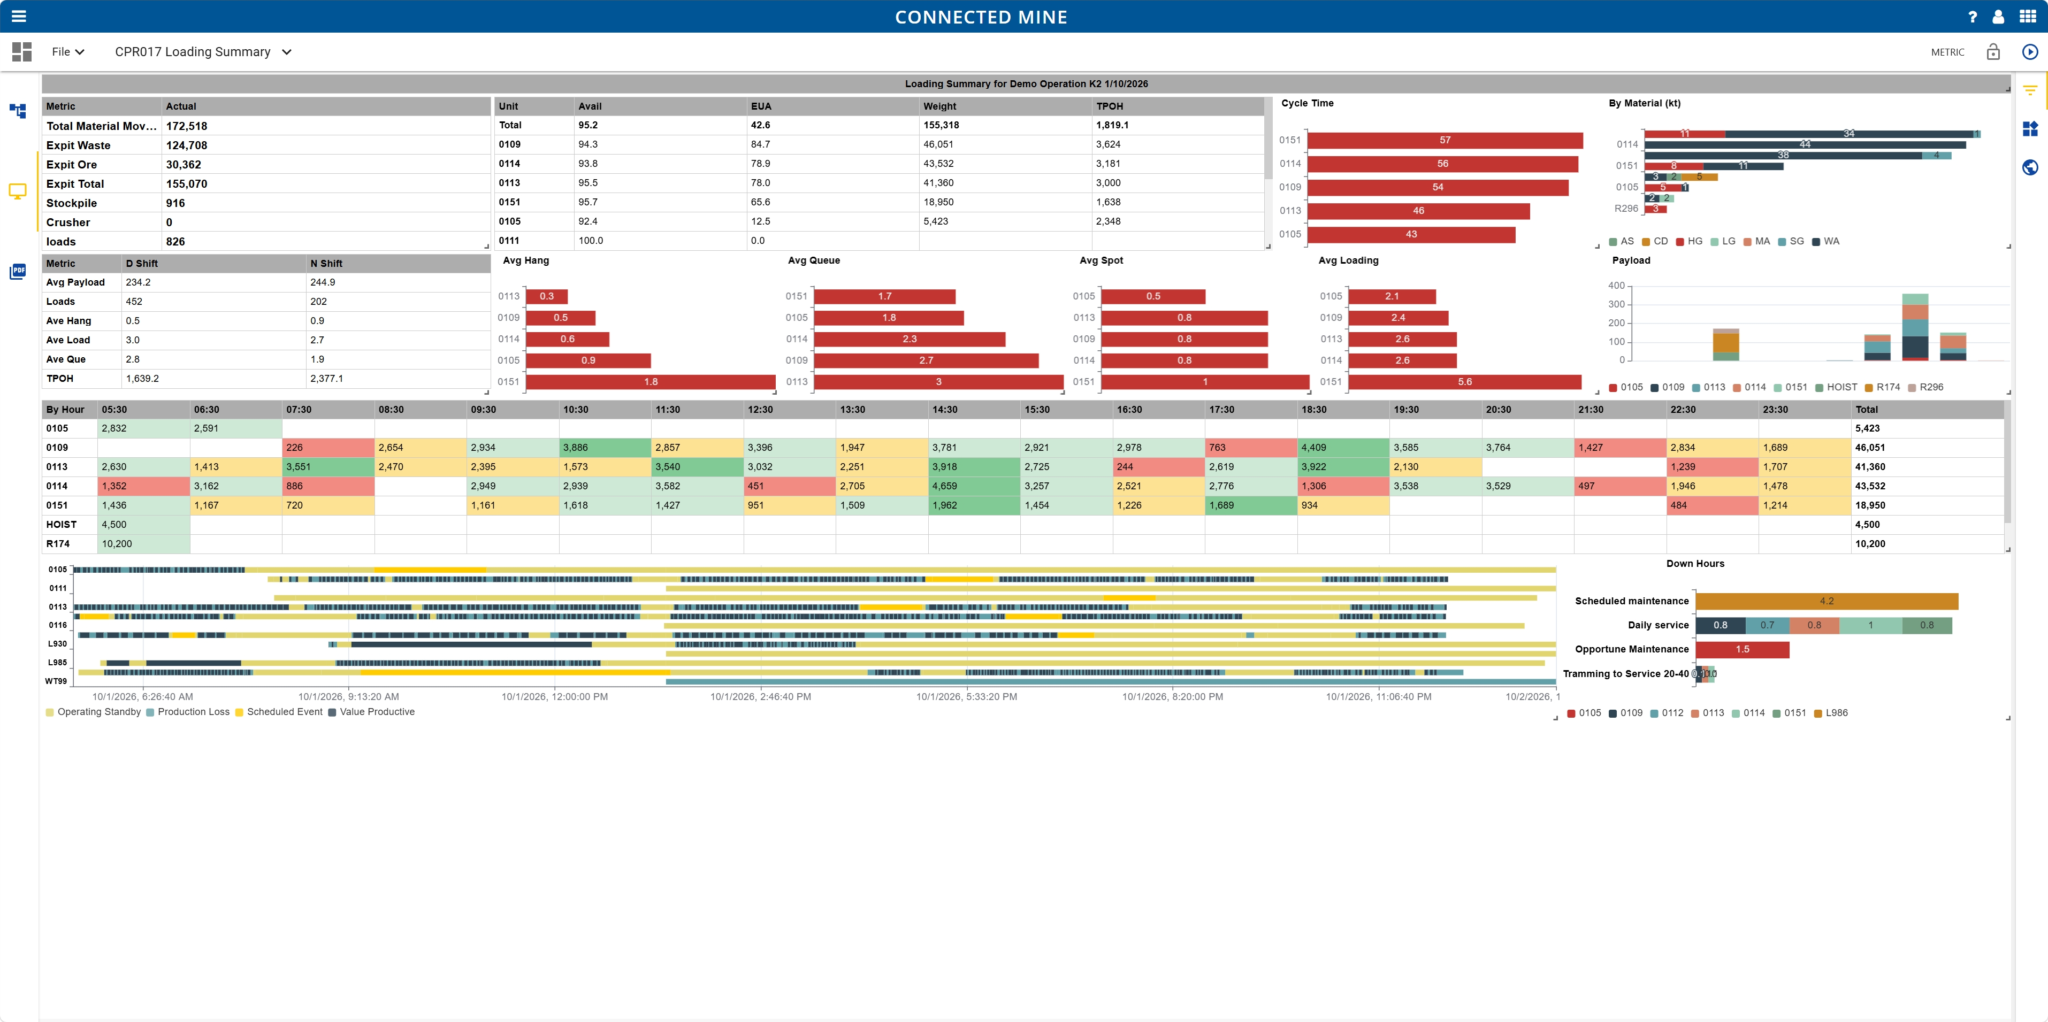
Loading summary: material moved, cycle times and payload by loader
Spatial components sit in the same palette, so a map or a replay is built like any other report. The full 4D view is Connected Spatial Intelligence.

A unit animation built from three queries
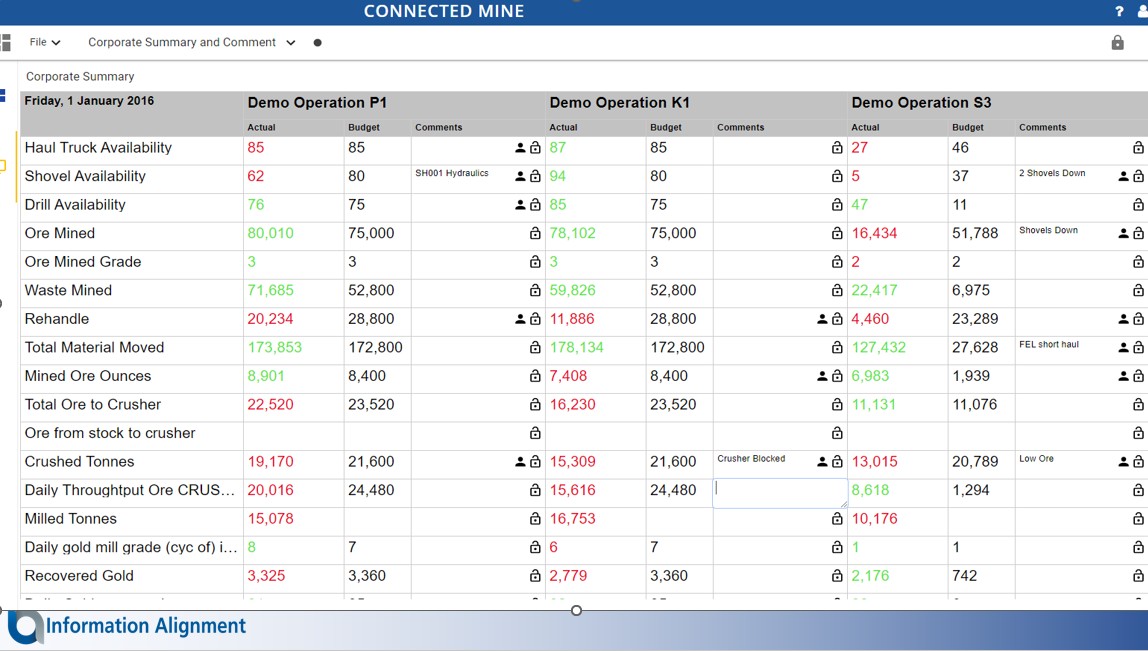
Corporate summary: three sites against budget, with comments on each variance
Comments are attached to the numbers they explain, at any level of detail, so the story behind a variance is never lost.
C-DAS is built into every Connected Mine module, so every report reads the same validated data through the same definitions.
Business logic, rules, tolerances and key metric definitions are stored in one place and used by everyone.
Define a new metric once and share it, instead of rebuilding it in every spreadsheet.
Production, drill and blast, plant, metal balance and spatial data, reported in one tool.
Keep reporting in C-DAS, publish to Power BI, or feed your own BI stack. The numbers are the same either way.
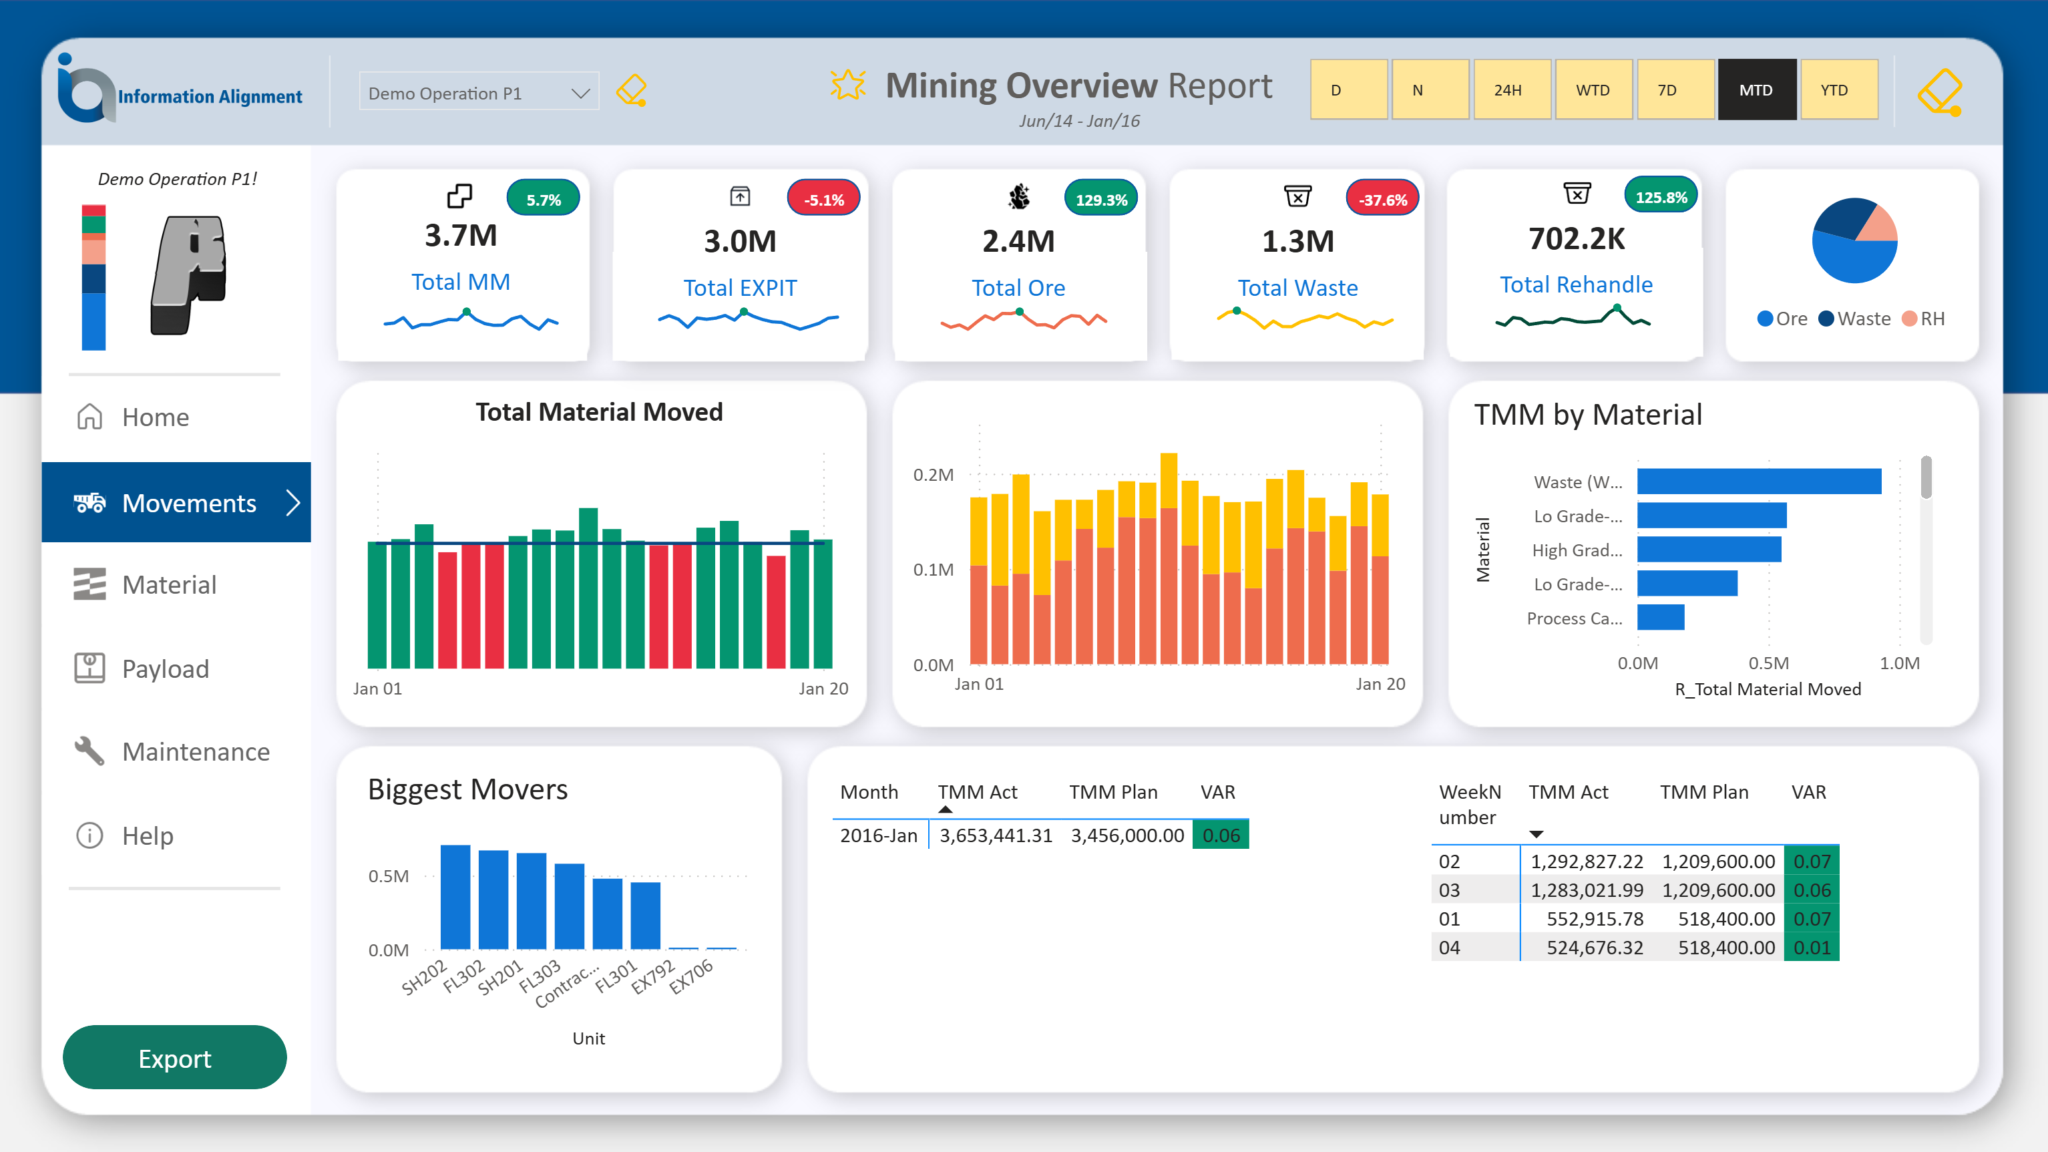
FactStream and StarStream in Power BI
What is Connected Data Analysis Services?
Connected Data Analysis Services (C-DAS) is the reporting and analysis layer built into every module of the Connected Mine platform. It turns validated mine and plant data into dashboards, reports and analysis.
How are reports built?
Visually. You connect query, transform and visualise components on a canvas, and each step shows its row count and run time. Experienced analysts get advanced functions, and casual users can work with drag and drop.
Which charts and views are available?
Tables, matrices, multi-charts, waterfalls, treemaps, Sankey, Gantt, gauges, heatmaps, calendars, scatter and pie charts, process diagrams and spatial views.
Can we add comments to the data?
Yes. Comments can be added at any granularity and stay linked to the data they explain, which gives a solid base for audit.
Does it work with Power BI?
Yes. Reports can be published to Power BI, and FactStream and StarStream provide a ready-to-go star schema of Connected Mine data for Power BI, Microsoft Fabric and Databricks.
Is it a separate product?
C-DAS is the reporting and dashboard layer of the Connected Mine platform, built into every module, from mine performance to process performance and spatial intelligence.
See C-DAS running on your own mine and plant data.