Connected Data Analysis Service (DAS)
DAS is an enterprise class ad-hoc analytics tool that offers rich data visualisations and advanced analytic functions. DAS utilises the power of the SQL platform delivering a function filled, ad-hoc tool designed for use by experienced data analysts. Given its standard design it also provides an easy to use and intuitive tool for the less practiced and informal data user.
DAS has been designed to handle very large data sets with many dimensions, members and measures, and was built from the ground up to allow users to rapidly query multi-dimensional data sources. Users can view trends, rapidly identify and focus on any data anomalies (“slice”), and then drill across or through the data dimensions and filters (“dice”) to present a view for publication.
DAS has been built using the latest application design concepts and contains functionality that satisfies all requirements of a user viewer application.
DAS provides a platform for constructing personal focus charts along with enterprise focus points within the same paradigm and delivering business analysis results to wider enterprise audiences is very simple.
DAS user interface is highly user friendly, intuitive and consistent with industry standards for the use of drag and drop features and recognisable navigation functions. Casual users are able to navigate through the many functions with ease whilst more expert analysts will connect with many higher end features and functions including the ability to build and export MDX queries. Users can then easily share the results of their investigations, and allow other users to use their investigation as starting point for further analysis.
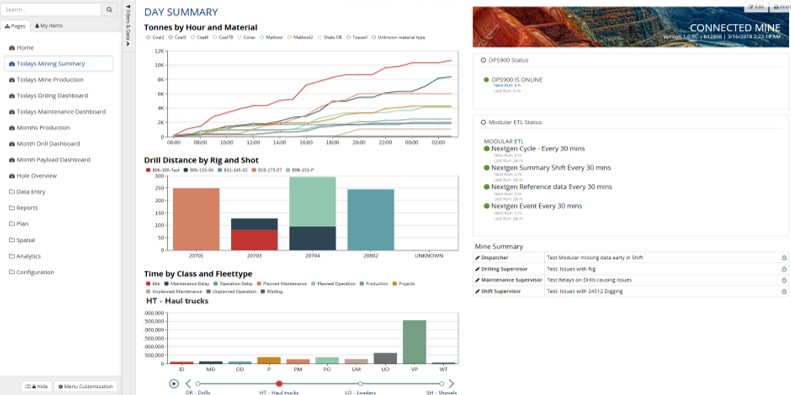
The DAS Workbench, as an integrated component of Connected Solutions, provides graphical options including bar, line, pie and clustered variant charts, gauges, scatter plots, decomposition charts, and organisation charts and is fully integrated with the Pagebuilder dashboard tool for the distribution of results in a very short timeframe. Other objects such as process diagrams or spatial intelligence windows can be built into the DAS view.


![shutterstock_1390292588 (1) [Converted]](https://inapl.com/wp-content/uploads/2021/08/shutterstock_1390292588-1-Converted.png)


